User Activity Monitoring
The Analytics Dashboard provides administrators with real-time visibility into:
User login trends
Blocked URL activity
Inactive users monitoring
Historical activity logs
This dashboard enables security teams to monitor engagement, detect anomalies, and enforce security policies effectively.
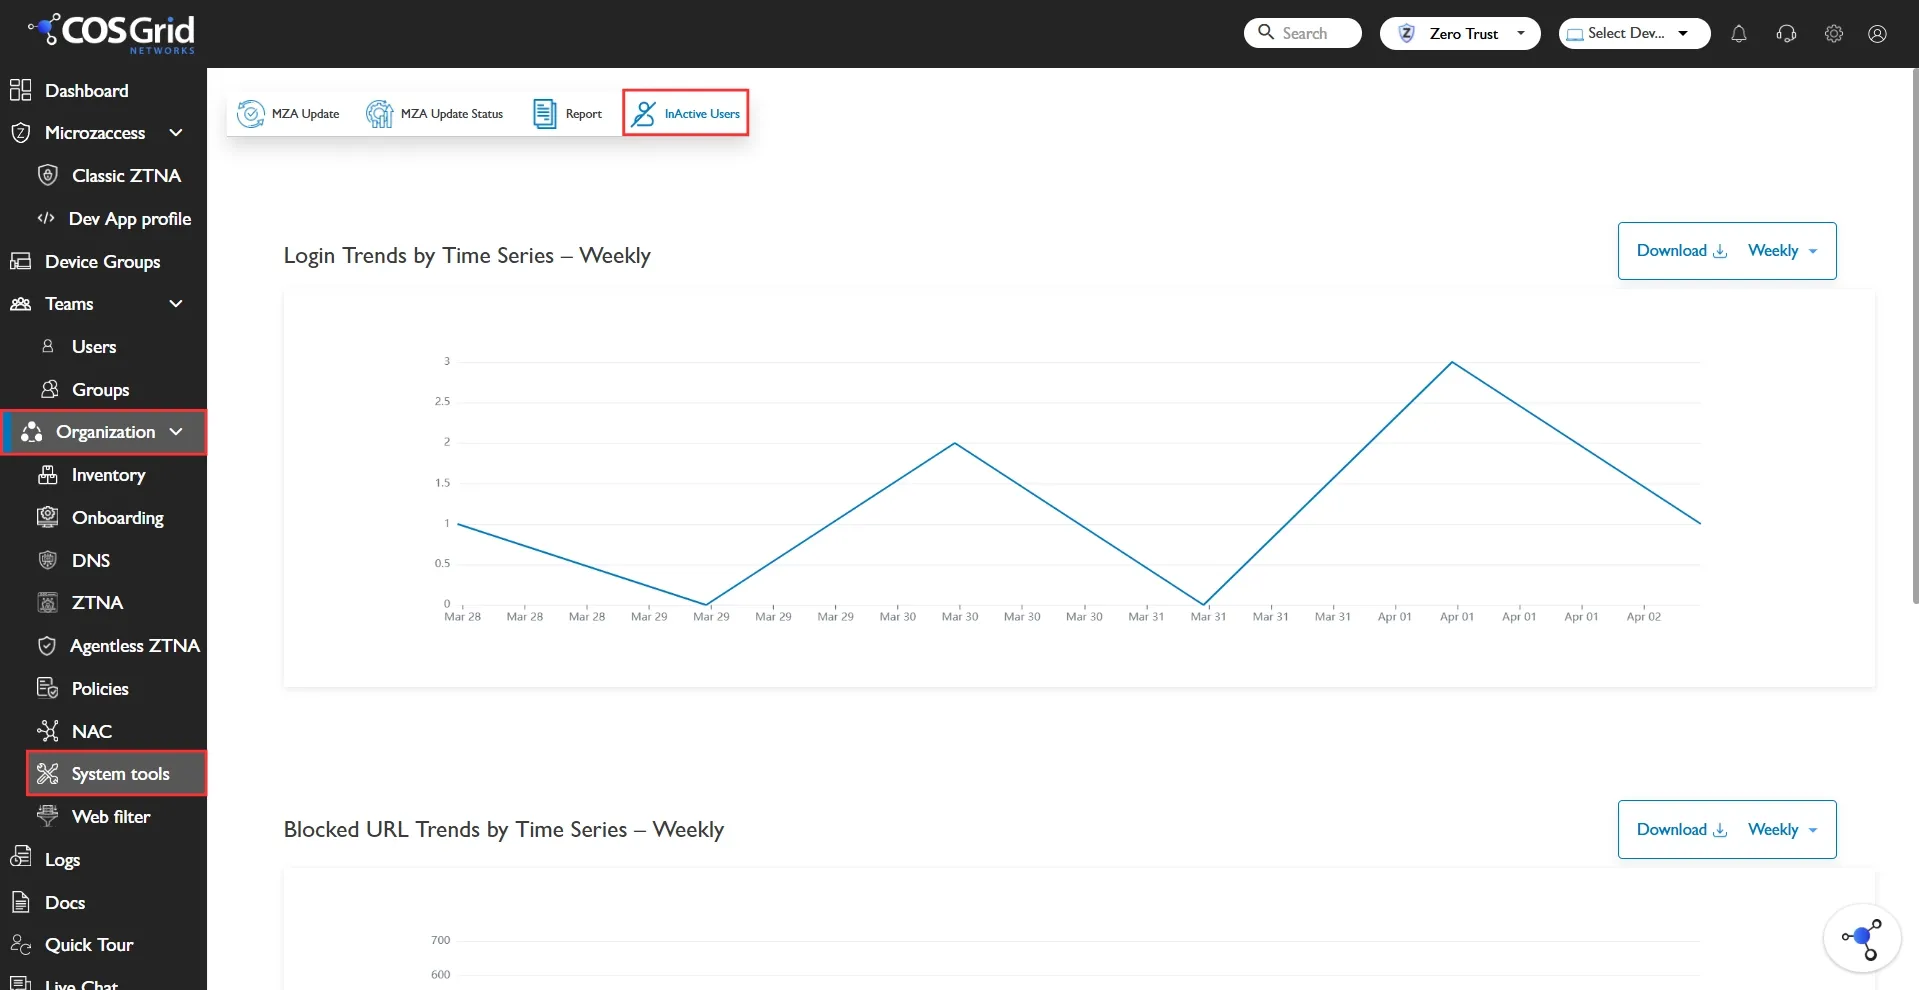
Login Trends by Time Series (Weekly)
Description
The Login Trends graph displays the total number of successful user logins over a selected time period (default: Weekly).
Purpose
Monitor user engagement
Detect unusual login spikes or drops
Identify adoption patterns
Support security investigations
Key Features
Time-series line graph
Time filter (Weekly / configurable)
Download option (export report)
Real-time visualization
Use Cases
Identify sudden login surge (possible security event)
Track adoption during new feature rollout
Compare login behavior week-over-week
Blocked URL Trends by Time Series (Weekly)
Description
This graph shows the number of URLs blocked by security policies during the selected time frame.
Purpose
Monitor web access control effectiveness
Detect risky browsing attempts
Identify policy violations
Key Features
Weekly trend visualization
Downloadable report
Time-based filtering
Administrative Benefits
Measure policy enforcement effectiveness
Identify departments triggering most blocks
Detect malware or phishing attempts early
Inactive Users Section
Description
This section lists users who have not logged into the system within a defined period.
Table Columns
Column Name | Description |
|---|---|
Last Seen | Last login date & time |
Username | Registered user email/ID |
No. of Inactive Days | Number of days since last login |
Total Historical Logs | Total number of past login records |
Controls Available
Search
Filter (Last 7 Days / configurable)
View settings (Column customization)
Refresh
Action
Filter
Download
Purpose
Identify dormant accounts
Reduce attack surface
Enforce account lifecycle policy
Support compliance audits
Recommended Admin Actions
Disable accounts inactive > 30 days
Notify users inactive > 7 days
Audit inactive accounts quarterly
Export & Reporting
Each graph and table supports:
Downloadable reports
Weekly aggregation
Data export for audit or compliance review
Supported for:
Internal security reviews
Customer reporting
Compliance documentation
Incident analysis
Security & Compliance Value
This dashboard helps achieve:
Zero Trust monitoring visibility
Early anomaly detection
User behavior analytics
Audit-ready reporting
Risk reduction through inactivity tracking